Illinoisans spent $13,797 per student on K-12 public education in fiscal year 2015, according to U.S. Census data adjusted for cost of living. That spending is among the highest in the region and 13th highest in the nation.
A majority of those dollars – 63 percent in 2015 – come from local property taxes. Indeed, school funding is usually how politicians justify Illinoisans’ extraordinarily high property tax burden. Who wouldn’t want to invest more in his or her child’s future?
However, Illinoisans aren’t seeing a return on this major investment. In fact, Illinois’ public schools, though some of the most highly funded in the nation, fail to prepare their students for college.
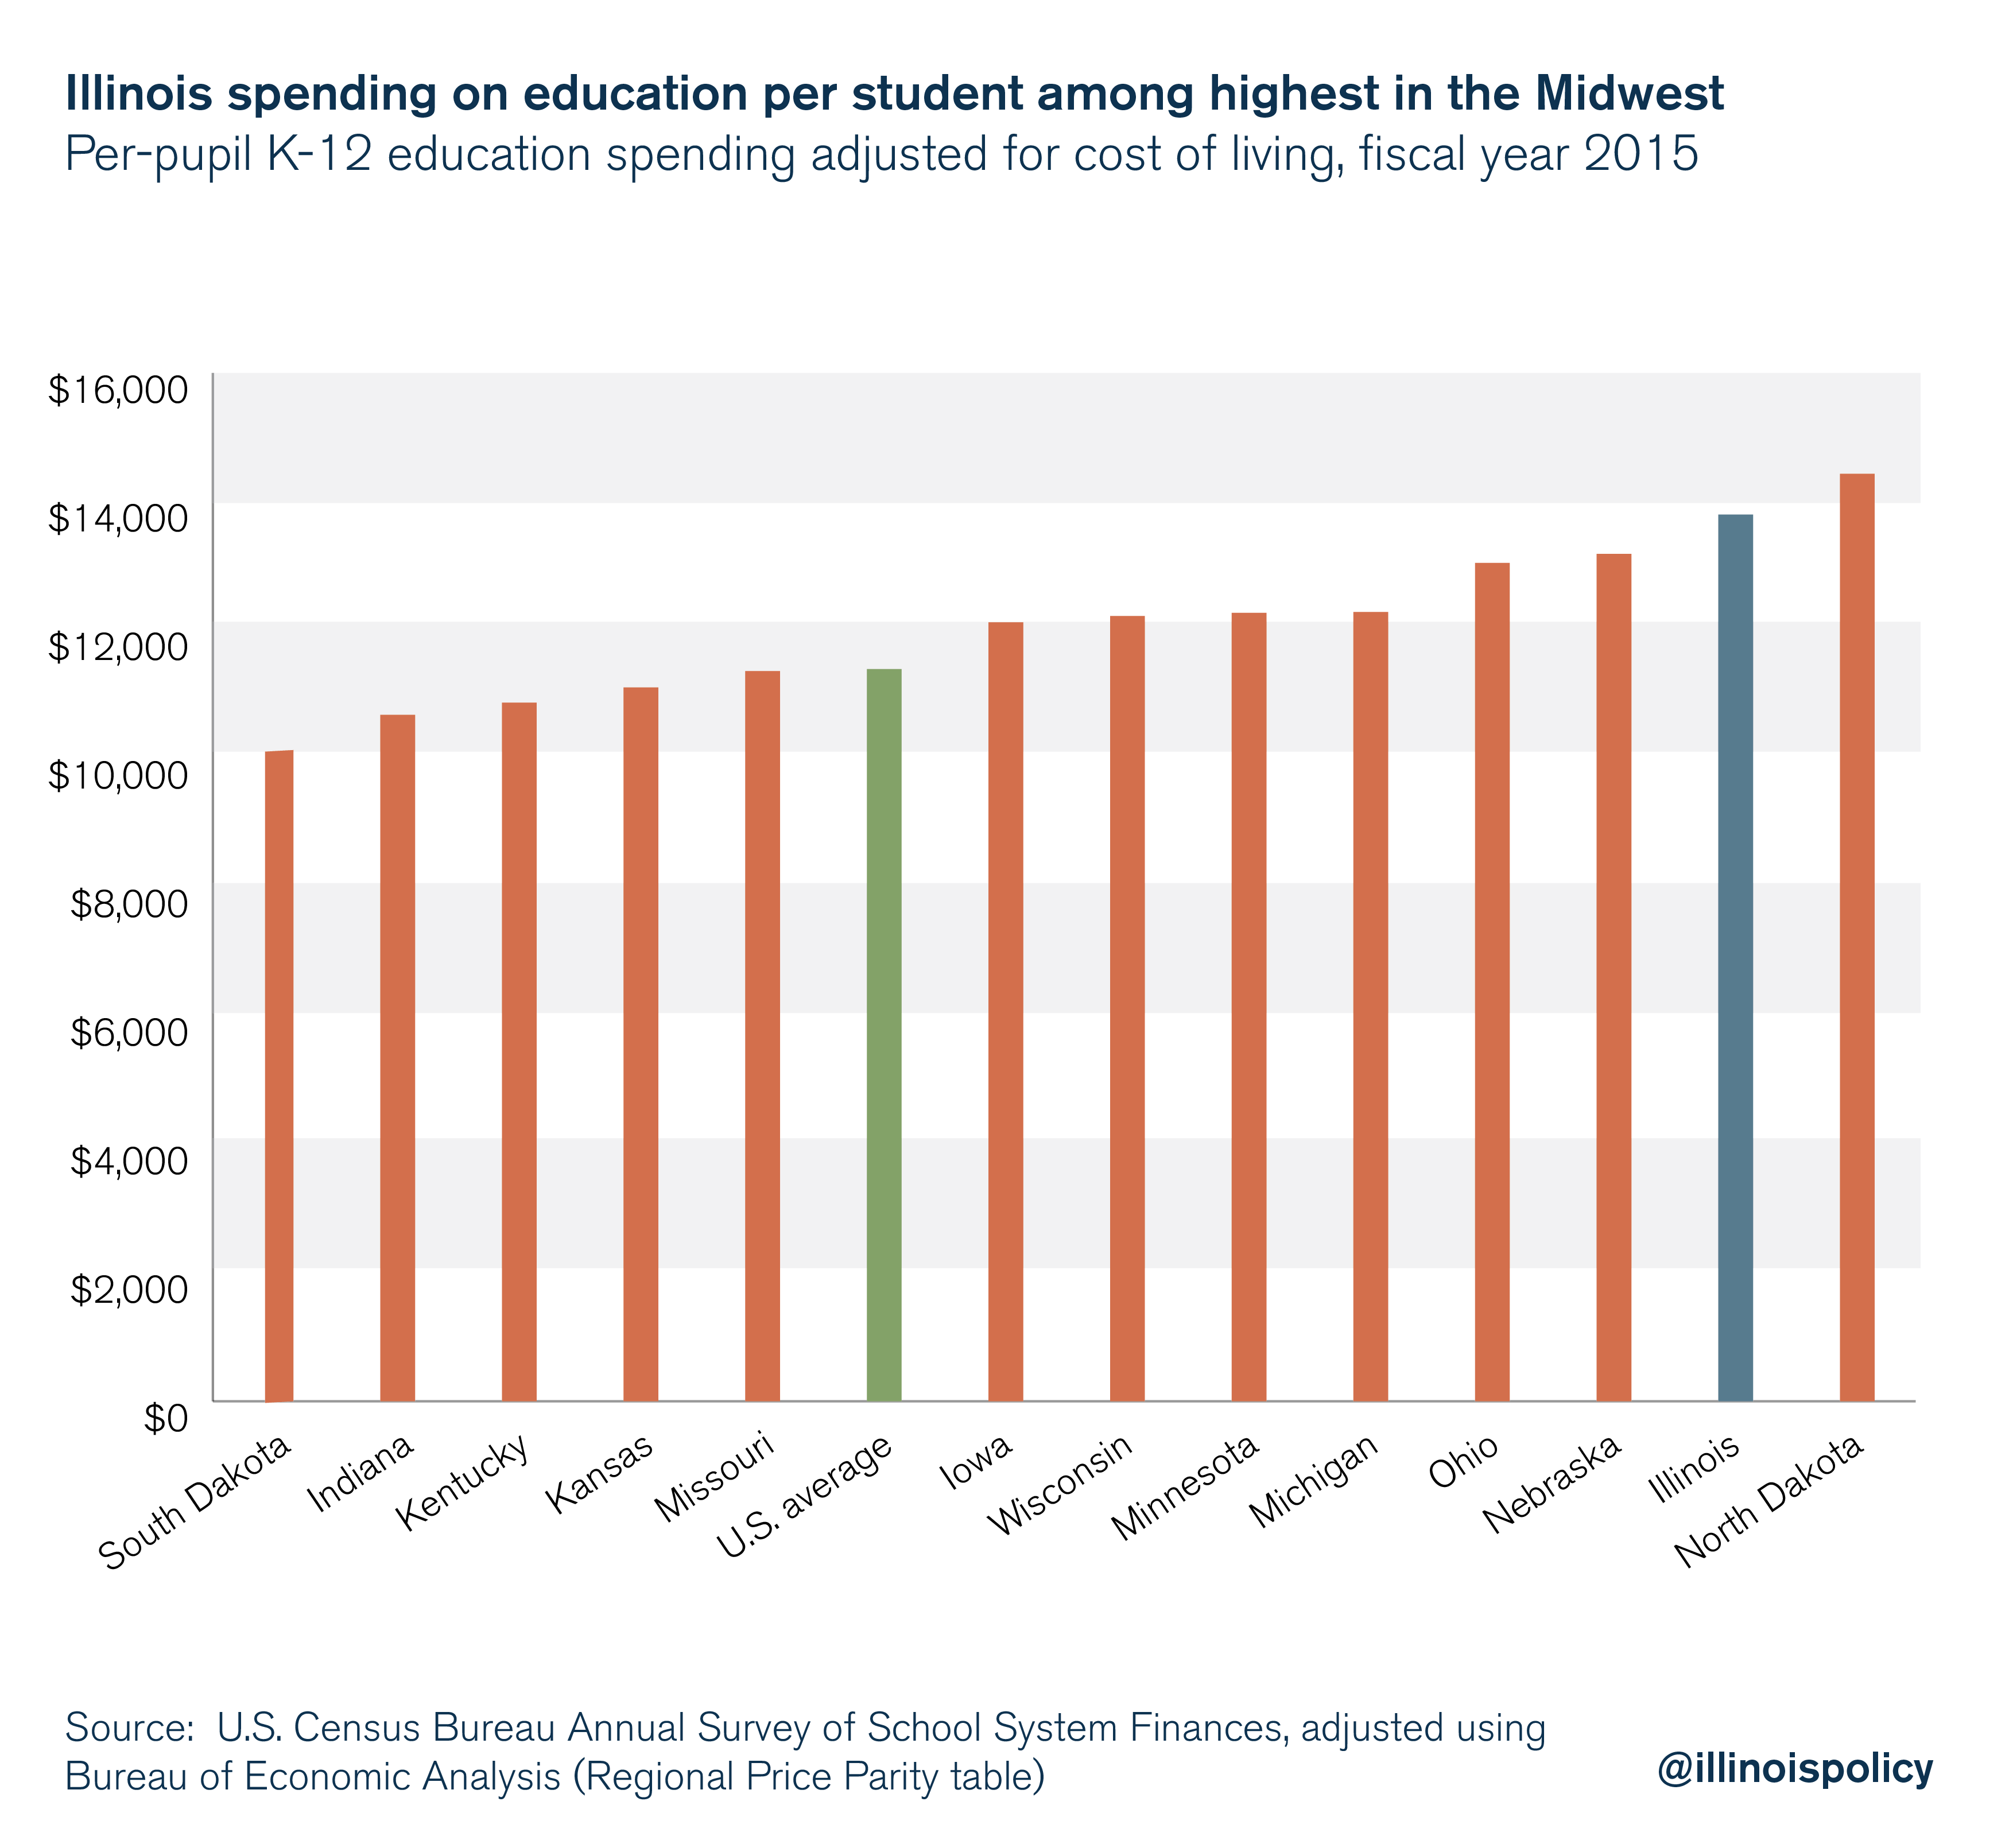
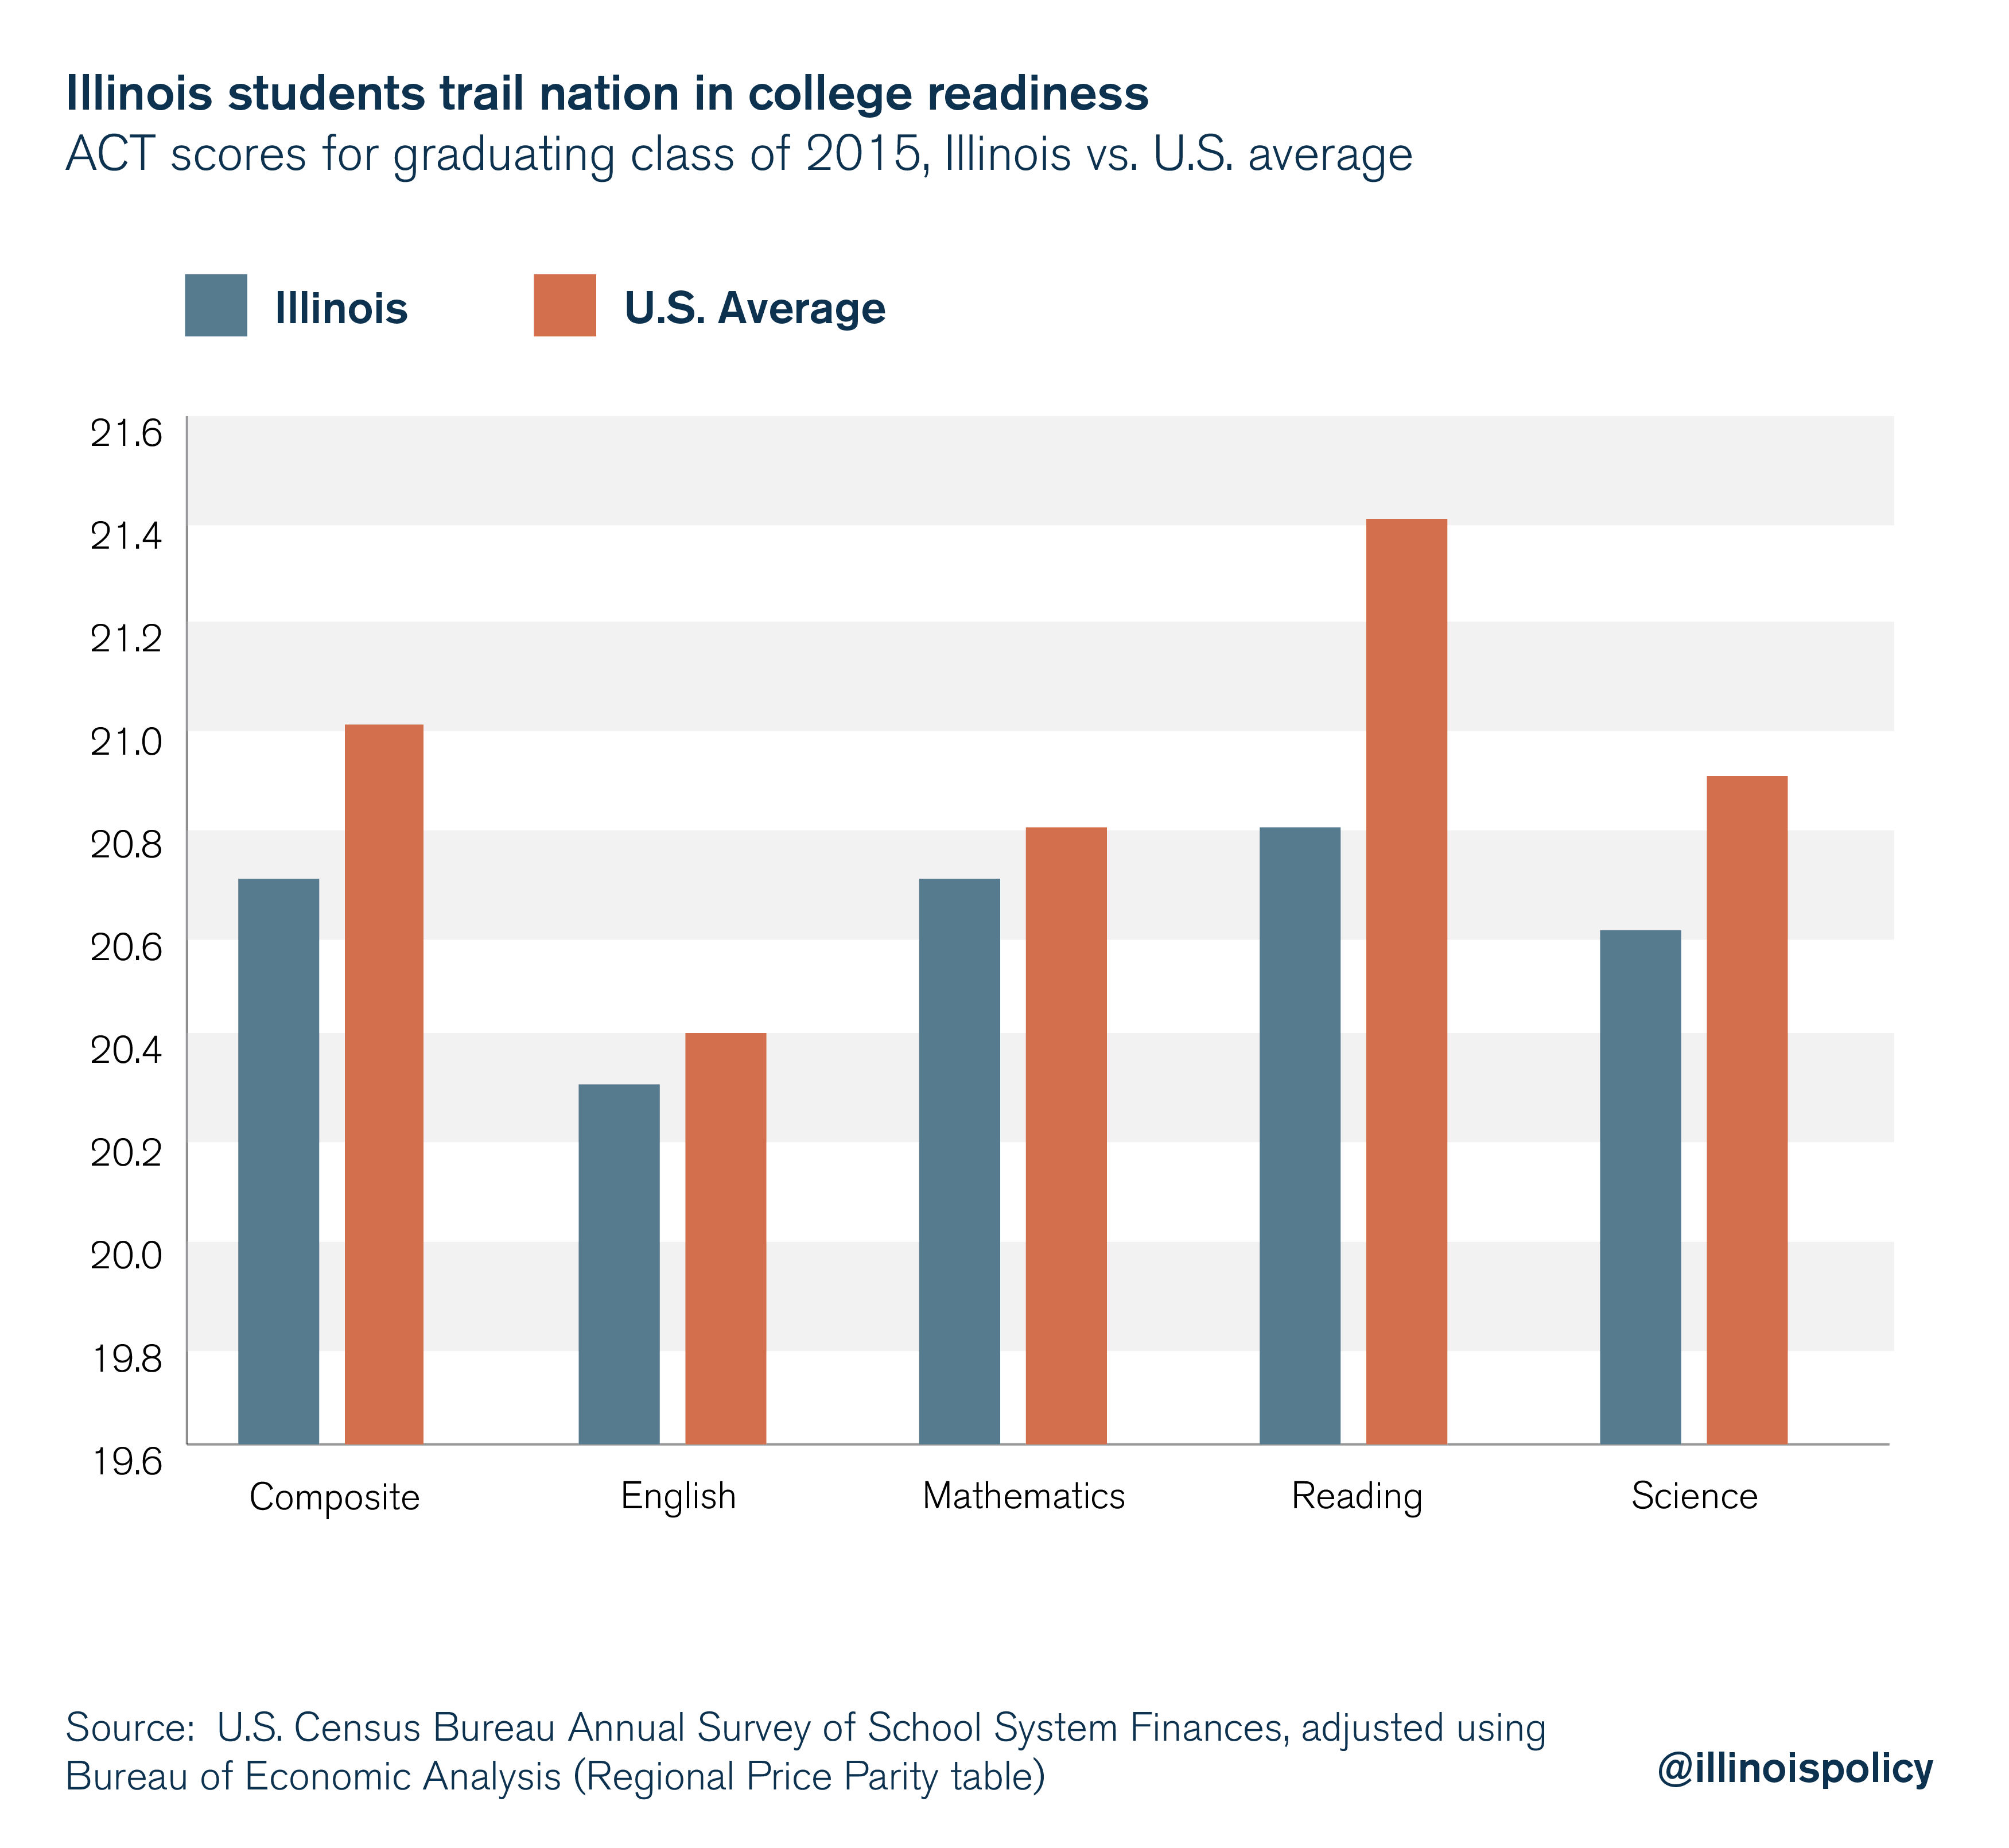
Despite Illinois spending more than most states on education, Illinois is decidedly in the middle of the pack when it comes to test scores, and below the national average in ACT composite scores.
Where are the tax dollars going?
Although Illinoisans have been repeatedly told that the only way to get better results for students is to pour more money into the system, this is not the case. Other states spend less but get better results.
Illinois is ranked 8th in the nation in administrative spending as a percentage of education spending, according to U.S. Census Bureau data. In other words, a good chunk of Illinoisans’ property tax dollars don’t make it to their child’s classroom. Instead, those dollars went to fund bloated administration costs that stem from having more than 850 school districts.
Other states do more with less
The fact that other states do more with less illustrates more education spending isn’t a necessary condition for better outcomes. A number of states that spend less money per student than Illinois are seeing better results in national test scores.
Take a look at Virginia, for example.
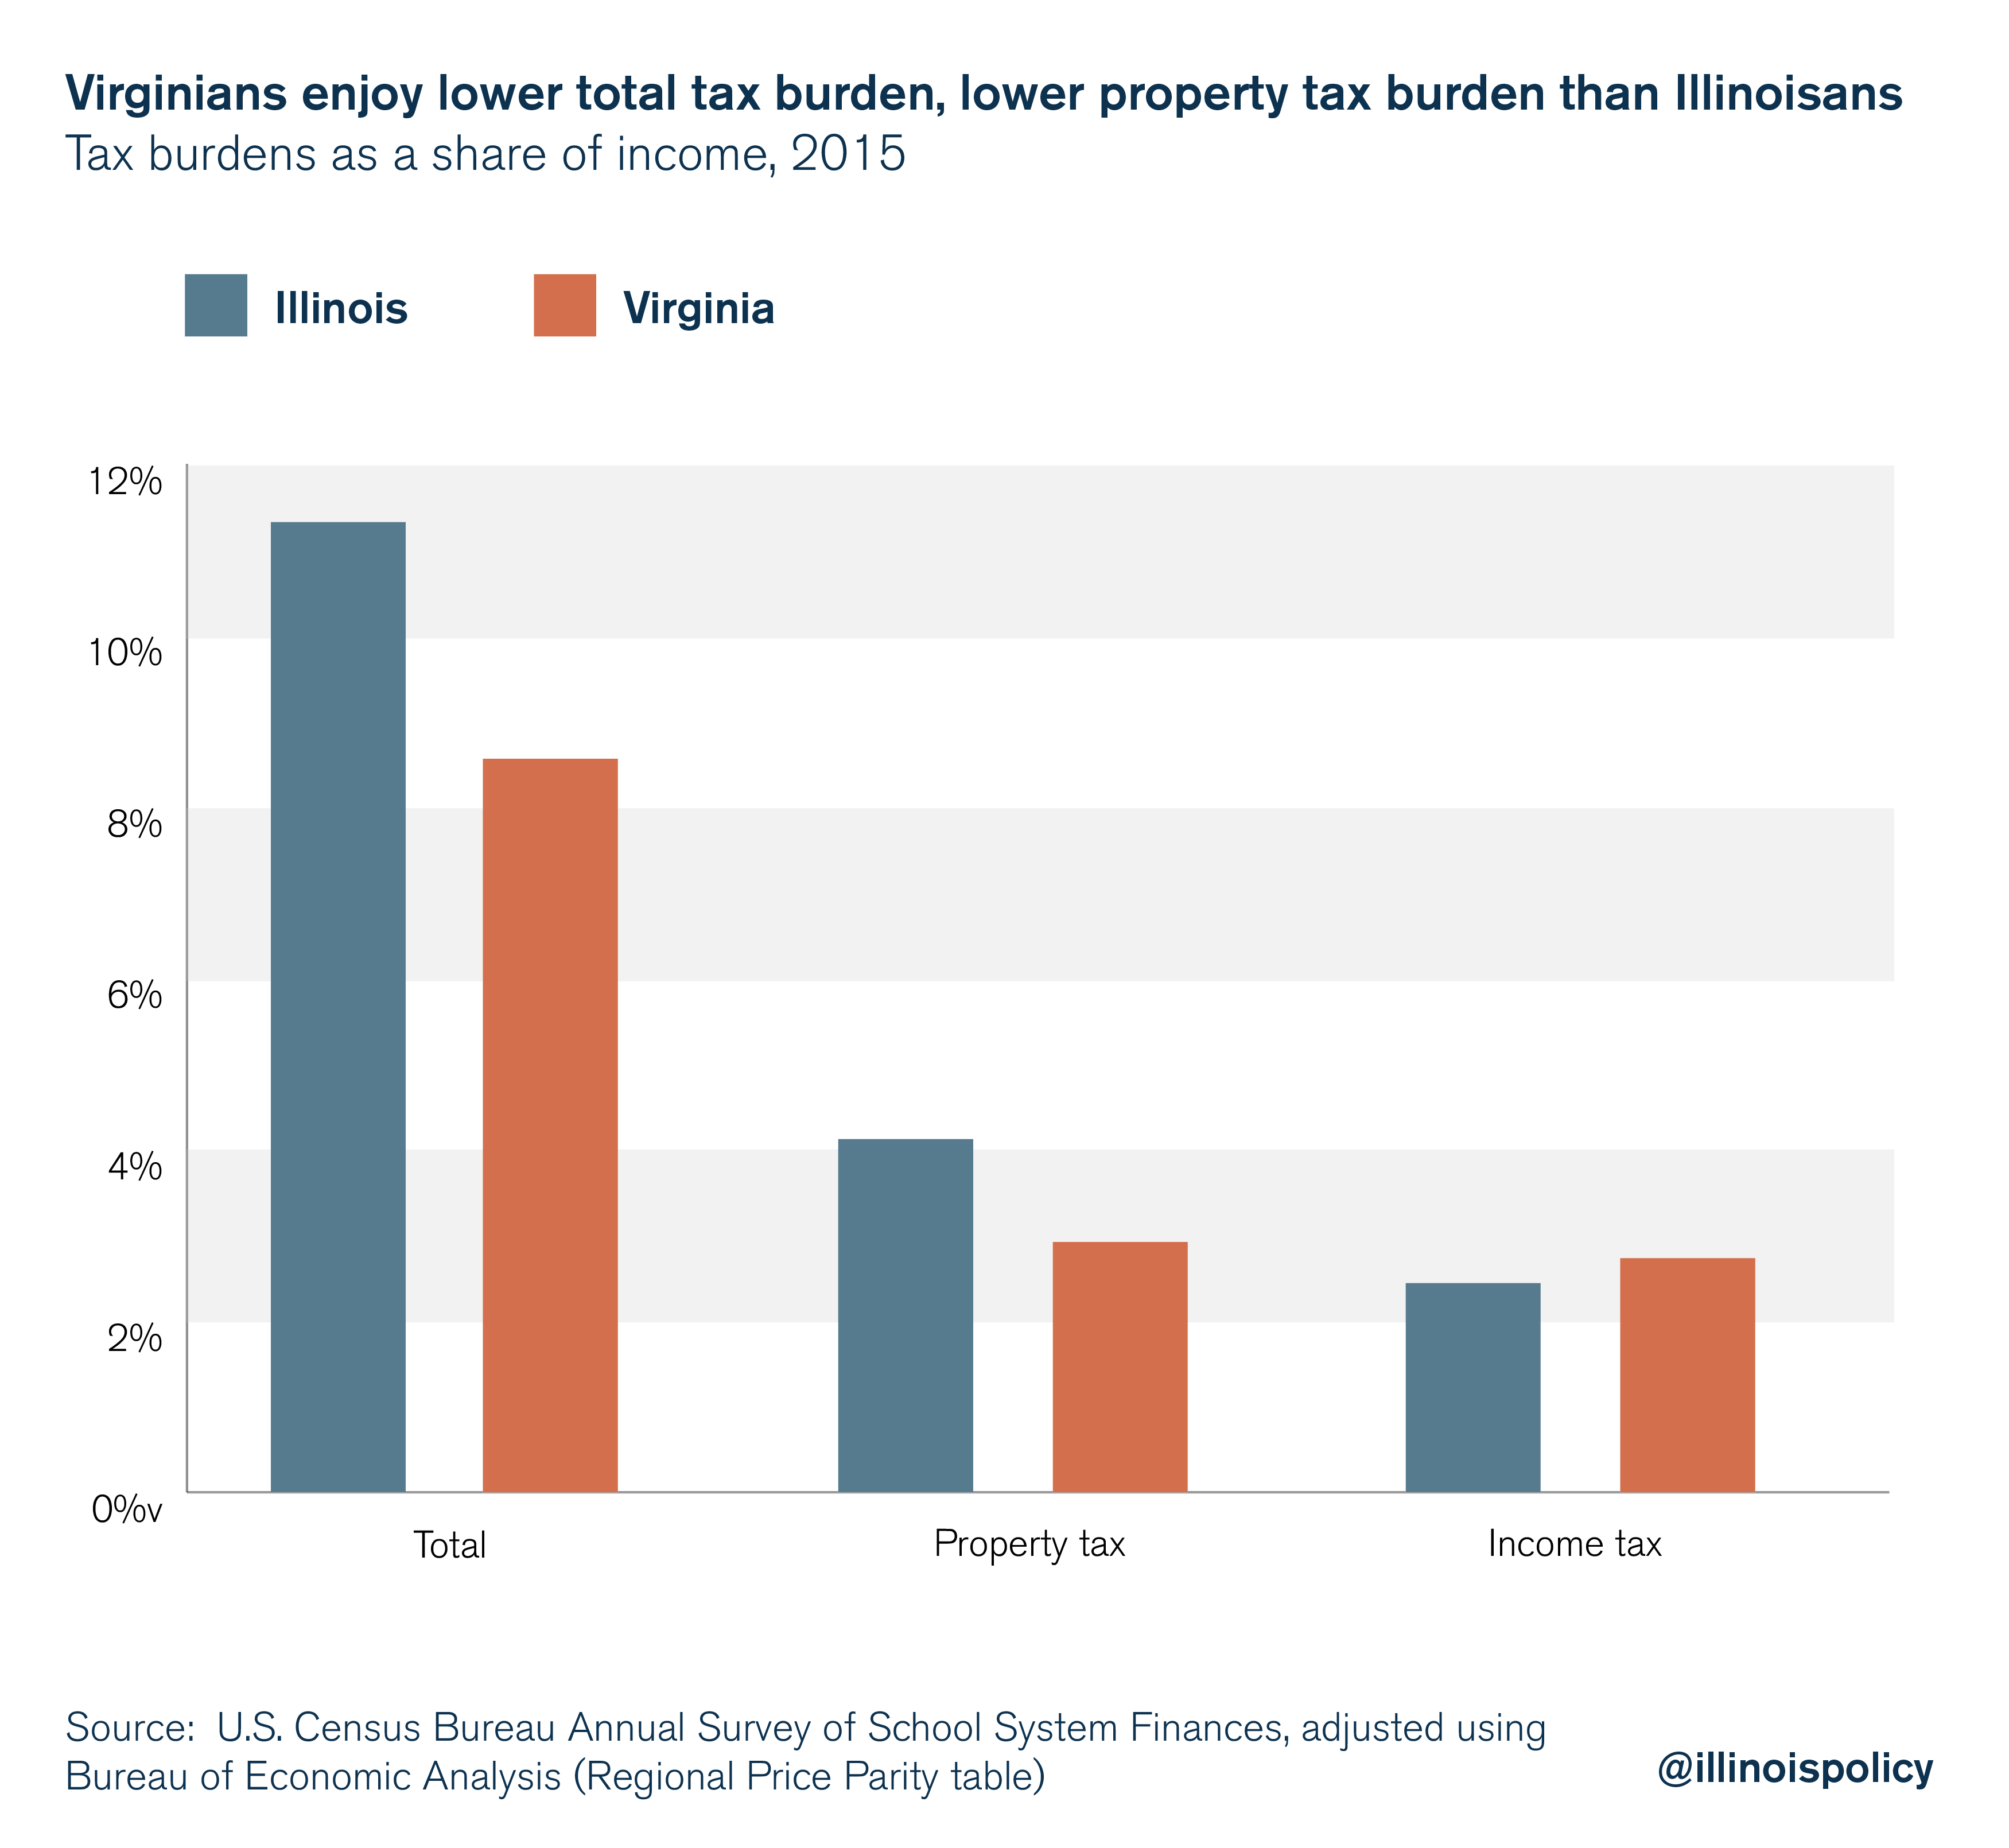
Virginia funds its public schools much in the same way that Illinois does, relying on federal, state and local sources in similar proportions. Virginia local governments are only slightly less dependent on property tax collections, which make up 35 percent of their revenues, while Illinois property tax collections make up 40 percent of local government revenues.
However, Virginians have a property tax burden that is 24 percent lower, and an overall tax burden that is 29 percent lower than what Illinoisans face.
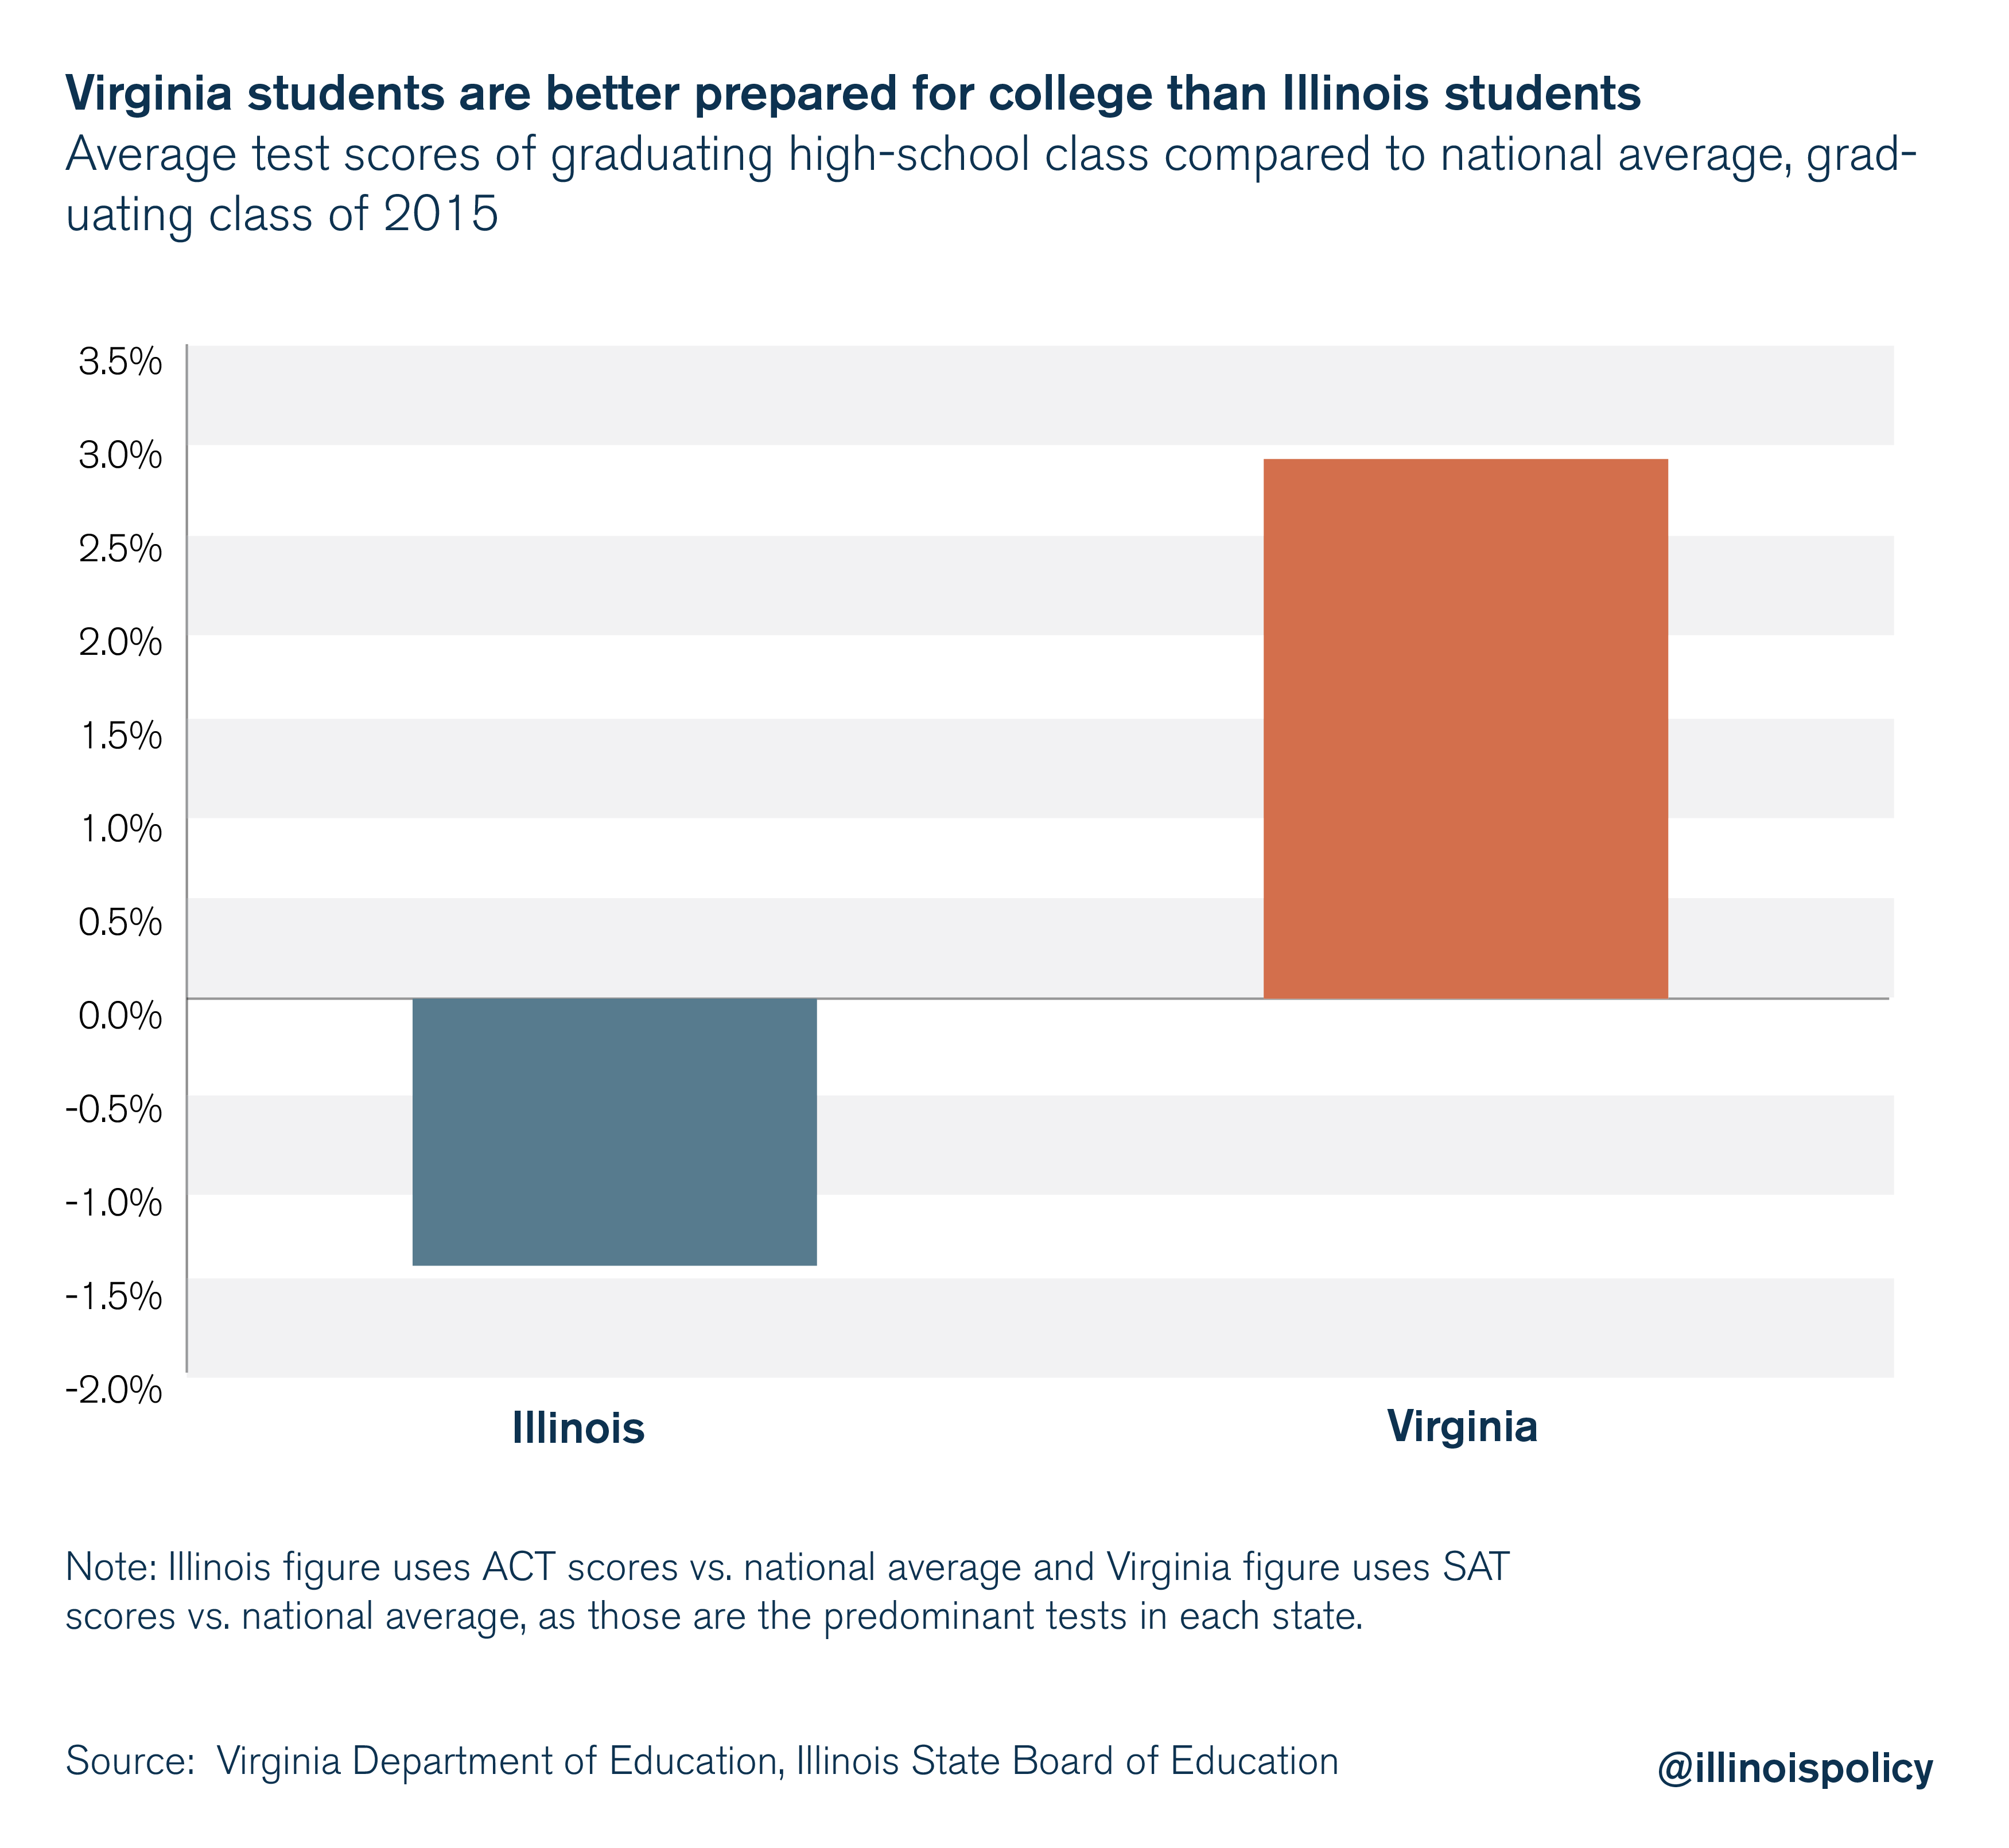
Meanwhile, Virginia’s public school system has a higher four-year high school graduation rate and better prepares its students for college than Illinois’. ACT scores in Illinois (the dominant standardized college admission test in the state) were 1.4 percent below the national average, while SAT scores in Virginia (the dominant test in that state) were 2.9 percent above the national average.
How does Virginia accomplish this?
Virginia manages to ensure better educational outcomes for its students than Illinois despite spending 20.5 percent less per student. How? Virginia accomplishes this because it has created an education system that makes student and instructional spending the top priority.
In 2015, Virginia ranked 30th nationally in administrative spending as a percentage of total education spending, according to the U.S. Census Bureau. Virginia spends $1,149 less per student on non-instruction costs and $2,834 less per student in total than Illinois, when adjusted for the cost of living in each state.
Virginia spends more efficiently by having a much more consolidated school district system, with fewer than 230 school districts compared with Illinois’ more than 850 school districts. The average school district in Virginia serves more than twice the number of students compared with Illinois, despite average enrollment per school being very similar.
Virginia is living proof that through consolidation and prioritization, states can provide better schooling outcomes and lower property taxes. Although Illinois and Virginia both fund their schools through local property tax collections, property taxes as a share of personal income in Virginia are 29 percent lower than in Illinois.
If Illinois were to learn from Virginia’s success and reduce administrative bureaucracy, it could alleviate the crushing property tax burden on Illinois families without jeopardizing their children’s education. Matching Virginia’s per-pupil non-instructional spending would have saved Illinois taxpayers $2.4 billion in 2015 alone.* These savings could be passed on entirely in the form of property tax relief, lowering Illinoisans’ property tax burden by 9 percent.
Although many other factors contribute to disparities in test scores, Virginia’s model would help to save taxpayer money and perhaps even improve student outcomes by prioritizing instruction in the public school system.
Better schools raise property values
Economists agree that better educational outcomes increase home values. Fack and Grenet (2010) find that an increase in public school performance of one standard deviation raises housing prices by up to 2.4 percent. Black (1999) finds that a 5 percent increase in test scores increases the amount parents are willing to pay for homes by 2.1 percent.
A decrease in the property tax burden coupled with an increase in home values would further lower the effective property tax rate for Illinois homeowners, whose home values are still 10.2 percent below pre-recession levels. Since homes represent the vast majority of the net worth of a family, lowering the tax burden and increasing home values will help make middle-class Illinoisans more prosperous.
Illinois needs education reform. Prioritizing students and emphasizing instructional spending over administrative spending can help to provide taxpayers with property tax relief, higher home values, and most importantly, better futures for their children.
*Calculated by multiplying Virginia per-pupil non-instructional funding figures by the number of students enrolled in Illinois schools in fall 2015, adjusted for cost of living in Illinois.